Last week, I had three systems with issues displaying the Top Updates in the Orient Me. So I tried to find out which applications and containers are involved in generating the content for this view.
First, we need to know that Top Updates are part of the Component Pack, and the content of Latest Updates is the Activity stream data, which is read from the homepage database.

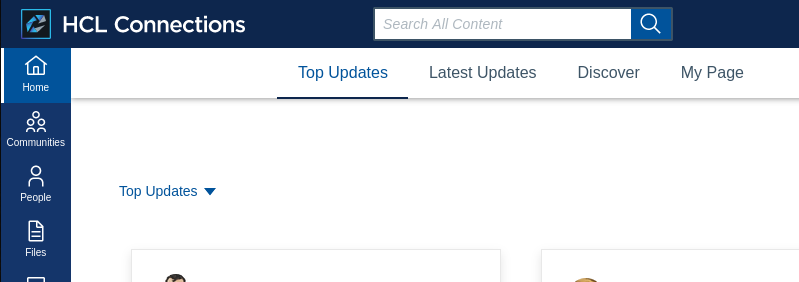
Screenshot of the Connections 8 Homepage
If the Top Updates tab is not visible after deploying the Component Pack, check LotusConnections-config.xml; the serviceReference for orientme needs to be enabled. There is only one serviceReference allowed for an application in this file, so check for duplicate definitions when the tab is still missing.
<!--Uncomment the following serviceReference definition if OrientMe feature is enabled-->
<!-- BEGIN Enabling OrientMe -->
<sloc:serviceReference bootstrapHost="cnx8-db2-was.stoeps.home" bootstrapPort="admin_replace" clusterName="" enabled="true" serviceName="orient" ssl_enabled="true">
  <sloc:href>
    <sloc:hrefPathPrefix>/social</sloc:hrefPathPrefix>
    <sloc:static href="http://cnx8-db2-was.stoeps.home" ssl_href="https://cnx8-db2-was.stoeps.home"/>
    <sloc:interService href="https://cnx8-db2-was.stoeps.home"/>
  </sloc:href>
</sloc:serviceReference>
<!-- END Enabling OrientMe -->
So where is the data for Top Updates stored?
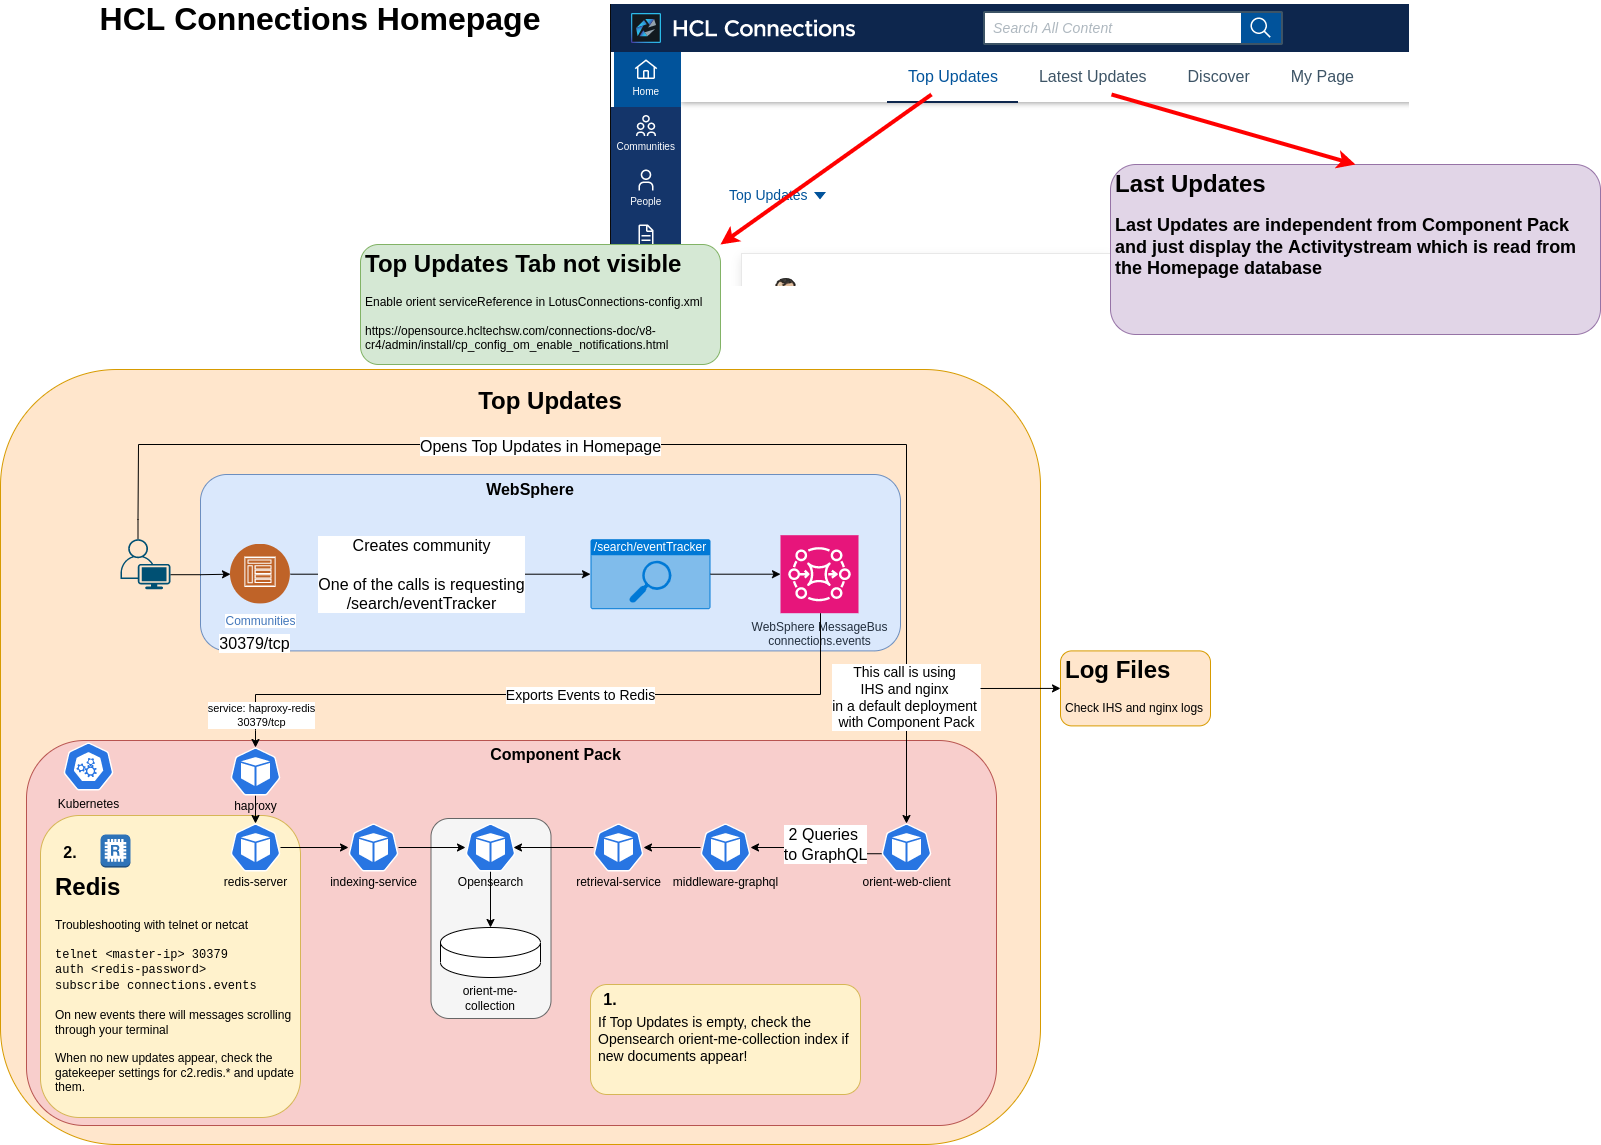
The data for Top Updates is read from the Opensearch/Elasticsearch index orient-me-collection. The data is processed first in WebSphere (/search/eventTracker) and sent through the SIB message store.
Then the message store publication point connections.events exports to Redis (redis-server:30379 via the haproxy-redis service) on Kubernetes. The indexing-service reads the Redis data and writes to the Opensearch orient-me-collection index.
I’m not 100% sure, but I expect that the retrievalservice and middleware-graphql pods are involved in reading the data for Top Updates. The GraphQL query is processed through orient-web-client.
Dependencies and troubleshooting steps

Flow of Homepage Lastest Updates and Top Updates
So the first step is to check if the events are written to the Opensearch index. Open a shell in the opensearch-cluster-client-0 and switch to the folder probe. Make a copy of sendRequest.sh and change the last print statement:
cd probe
cp sendRequest.sh send.sh
vi send.sh
Change line 27 to (add "" around the variable), this will print the output with newlines instead of one long string:
echo "${response_text}"
Now let’s check the index:
| |
In the last line, we see that the orient-me-collection, the 8th column with 164 needs to increase when new events appear. When you create a community, for example, this number should increase after a few seconds.
To check if the data is sent to Component Pack, you can check the Redis queue. You can open a shell on redis-server-0 and use redis-cli. Alternativly you can use telnet or netcat on any host to open a session on port 30379 on your Haproxy (connections-automation installs an haproxy on the Nginx host) or Kubernetes worker.
nc <haproxy or k8s-worker> 30379
To connect, you need your redis-password:
kubectl get secret redis-secret --template={{.data.secret}} | base64 -d
Example:
| |
Now create a community and check if messages appear in this nc session.
The article Verify Redis server traffic adds some more details on this topic.
If nothing happens in Redis, check the Gatekeeper settings at https://cnx-url/connections/config/highway.main.settings.tiles

The value for c2.export.redis.pass is ~@64 + the base64 encoded password.
There is a configure script in the Connections Automation repository - Redis Config , which does not update the Gatekeeper directly, but adds some update JSON files to the folder shared directory/configuration/update.
To make a long story short, in all three systems, the connection to Redis was somehow broken. I assume that during data migration, the gatekeeper settings were overwritten.
After checking the hostname, port and password, I restarted the environment, and Top Updates started showing updates.


